
Seeing a flood before the river does
In Chiang Mai, a gauge in the city can only see water that has already arrived. This is how our forecast for the River Ping looks further ahead: by watching the rain that has not fallen yet, and the dam that holds the flood back until it cannot.
The limit of watching the river
Chiang Mai floods from the Ping about once a decade. In October 2024 the river came through downtown at near-record height and the water at Nawarat Bridge reached 5.30 metres. The city's warning depends on a chain of river gauges upstream, and on models built on those gauges.
There is a hard limit built into that approach, worth stating plainly: a model that watches the river can only ever react to water that is already in the river. The gauge at San Sai is six to eight hours upstream of the city; Chiang Dao is about eighteen. So a gauge-only forecast can see a flood coming, at best, by the channel travel time. Beyond that it is guessing, and it does what all such models do when they run out of signal: it drifts back toward "tomorrow looks like today." On a rising river that means it arrives late and low. We measured it on the 2024 flood: at two days ahead, a gauge-only forecast lagged the real rise by close to a day and shaved the crest badly.
To see a flood earlier, you have to look at what causes it before it reaches the river. That means bringing in data the gauges cannot provide.
The data we combine
Our forecast draws on four kinds of information, not one. Rainfall is averaged across each sub-catchment rather than read from a single forecast grid cell, so one noisy point cannot trigger a false alarm.
Water level and discharge at P.1 (Nawarat) and the upstream gauges: Chiang Dao, Mae Taeng and San Sai. This is the water already moving, and it is what the traditional approach uses on its own.
Historical rain for training, and the ECMWF rainfall forecast for the next two days. The forecast rain is the crucial addition: it is water that has not reached the river yet, which is exactly what the gauges are blind to.
The reservoir's storage, inflow and outflow. This turns out to be the earliest signal of all, and much of this page is about why.
So the water balance is physical rather than fitted, and the model stays honest when a storm is unusually warm or dry.
Three models, one forecast
No single model is best at every range. We run three, each doing what it is best at, and weight them by how far ahead you are looking. The near term is a data problem; the long lead is a physics problem.
The traditional gauge-only approach is essentially the short-lead half of the third layer, without the rainfall or the dam. Our contribution is the two things it structurally cannot have: the rain that has not fallen yet, and the dam that is holding the flood back until it cannot.
The dam alarm, days ahead
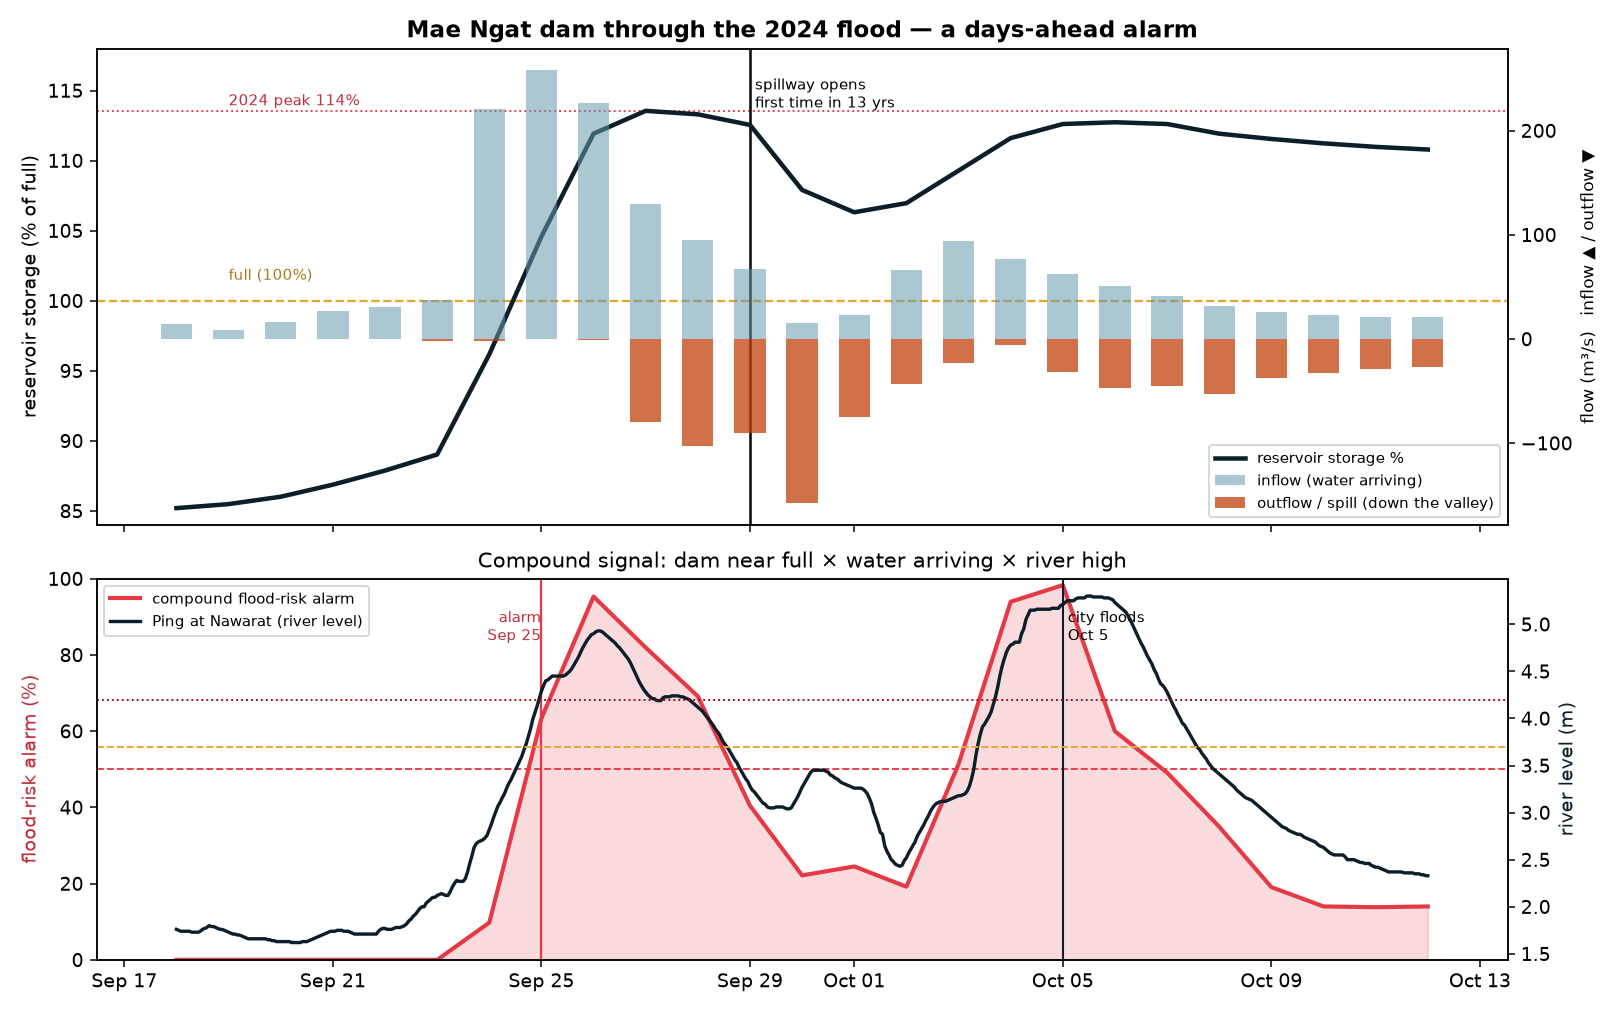
Sixty kilometres up a tributary of the Ping sits the Mae Ngat Somboonchon dam. For most of the year it is a shock absorber: it catches the monsoon and lets water out slowly. But a full dam cannot absorb anything, and its state through late September 2024 is the clearest early-warning signal in the whole basin.
A full dam is not, by itself, a flood. The danger is specific, and it is a rule you could write on a whiteboard: the flood risk is high when the dam is near full, and rain is still arriving, and the river is already up. Any one of those alone is survivable. All three together is when the alarm should ring. We encode that as a compound signal that multiplies the three factors, so it only rises when all three are elevated.
On the 2024 flood it crossed its threshold on 25 September, ten days before the city flooded, and four days before the dam opened its spillway for the first time in thirteen years. It is deliberately simple: when it fires, you can say exactly why. And it needs no training data, which matters, because the modern record holds only two floods. You cannot learn a rare three-way rule from two examples, so we write it as physics instead.
The process model, one to two days ahead
The dam alarm tells you to worry. The process model tells you how much, and when. It is a physical rainfall-runoff and channel-routing model (an hourly GR4 model with Muskingum routing) of the four sub-catchments above the city, forced by the rainfall forecast and the dam's release.
Because it conserves mass, a bigger storm mechanically produces a bigger, later flood: there is no out-of-distribution cliff, so it extrapolates to a record crest instead of shaving it. In backtest it reproduced the 2024 peak from rainfall alone, to within about five percent, having never seen that flood. Run as a rolling forecast at one and two days ahead, it tracked the 2024 rise with little timing lag and no peak-shaving, where a gauge-only forecast at two days lagged by nearly a day.
The machine-learning nowcast, zero to one day ahead
In the first day, the live gauges carry most of the signal, and a statistical model reads them best. This layer is a gradient-boosted model (LightGBM) trained on the Royal Irrigation Department record together with discharge, upstream rainfall and the state of the dam.
Rather than a single line, it predicts the change six, twelve, twenty-four and forty-eight hours ahead, and reports a range, from which we read the chance the river tops its banks at 3.70 metres. Framing it as a change, not an absolute level, matters: the baseline is then "no change," so any accuracy is genuine skill rather than a model quietly repeating today's number. Its inputs rank the way a hydrologist would expect. Upstream rainfall over the previous days and the river's own recent history sit near the top, and when the dam's state is included, reservoir fullness is the second most important input of over a hundred.
It reduces error against a no-change baseline by roughly eighteen, fourteen and nine percent at six, twelve and twenty-four hours, and by more during flood hours. Honestly, at two days a purely statistical model adds little on its own; that is exactly the range where the process model and the dam take over.
Tested on a flood it had never seen
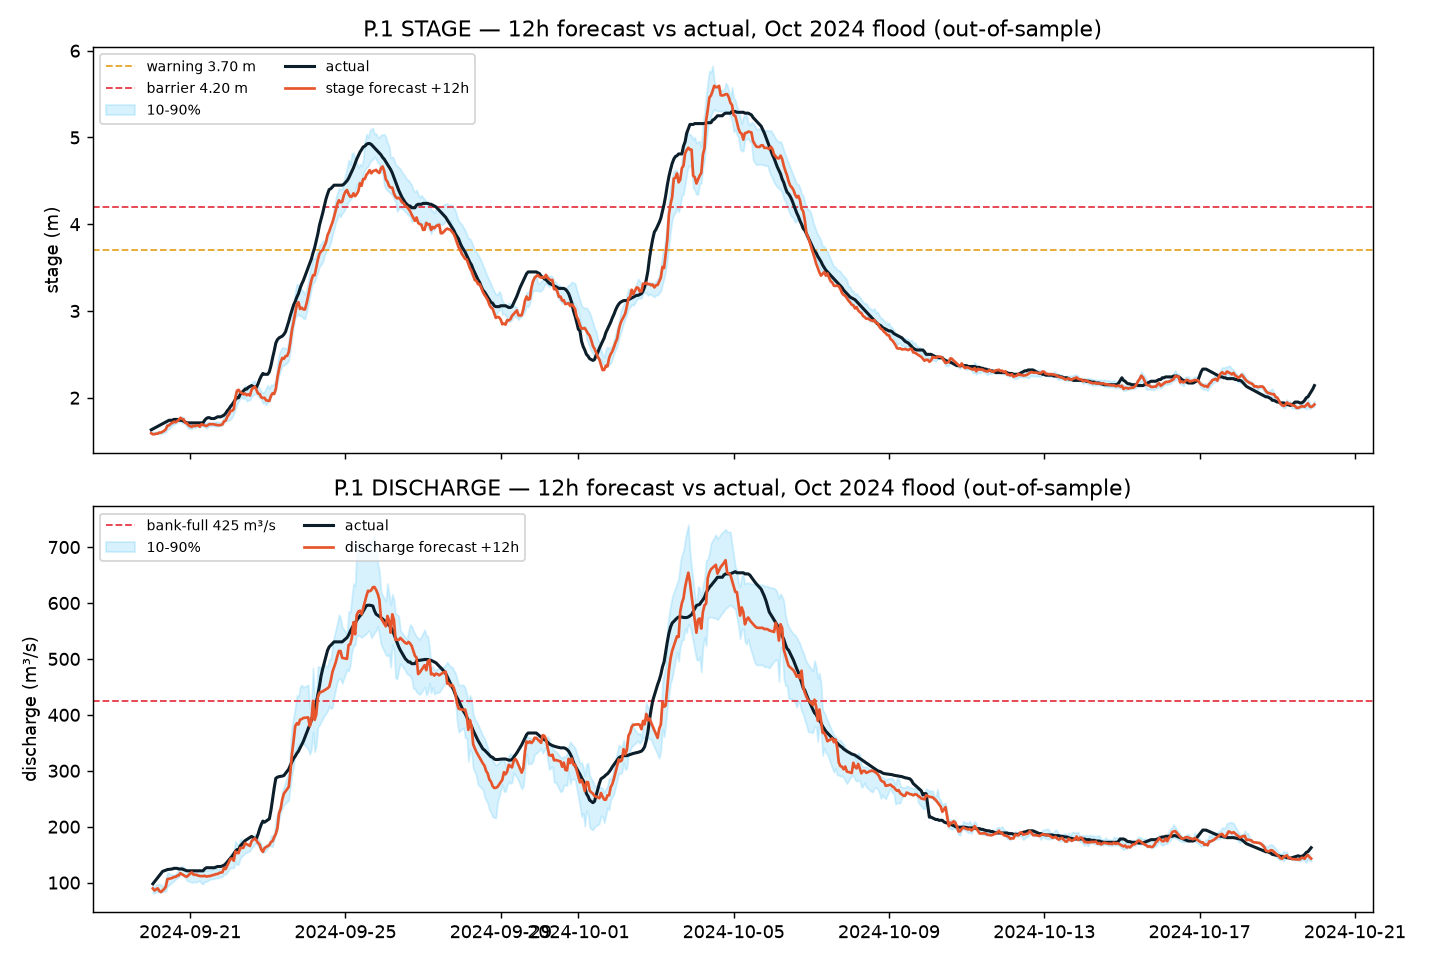
We test it the hard way. The model is trained only on data from before 2024, then asked to forecast the October 2024 flood it has never seen. The chart below shows the twelve-hour-ahead forecast (orange) against what actually happened (black), with the ten to ninety percent range in blue, in both the level people read (top, metres, against the 3.70 m warning and 4.20 m barrier) and the discharge the physics is built on (bottom).
How it runs
The whole system runs serverless on AWS. The models are trained offline and versioned; once an hour, a single function pulls the latest gauges, dam state and rainfall forecast, runs all three layers, and writes one forecast. The forecast is stored privately and is not yet exposed on the public dashboard. Where a plain-language warning is needed, a model is given the numbers and told to phrase them in Thai and English; it phrases, it never invents.
Honest about the hard parts
Two caveats we will not hide. First, the exact height of a record crest is genuinely hard to pin down, partly because the river gauge itself under-reads at extreme levels: once the Ping spills its banks, water bypasses the gauged channel, so the "official" peak is a floor, not the truth. Our physical model estimates the true, higher flow, which is the right thing to do for a warning even though it makes a tidy accuracy comparison against the gauge impossible.
Second, this is one event. The signal held on the 2022 flood too, but before any of this drives a public alert it has to prove itself on more of them. The direction, though, is clear: to warn a city days ahead, watch the rain and the dam, not just the river.